
 EN
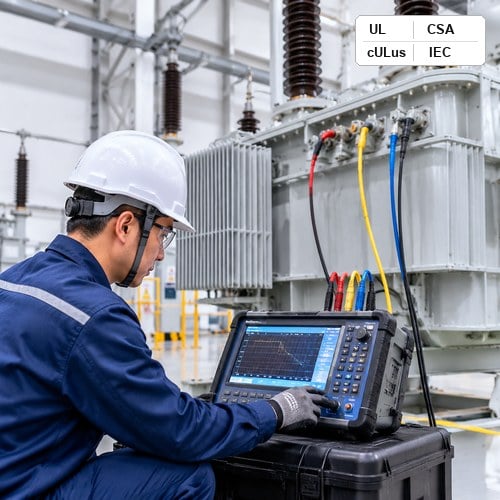
Why Visual and Ratio Inspections Fail to Catch Mechanical Transformer Damage
When a large power or distribution transformer arrives at an EPC project site in North America, commissioning teams routinely run standard electrical acceptance tests: insulation resistance, turns ratio (TTR), winding resistance, and power factor. These conventional tests excel at revealing gross electrical short-circuits or deteriorated paper insulation. However, they are virtually blind to internal mechanical displacement. A transformer coil that suffered axial collapse, conductor tilting, or core laminate shifting during ocean transit often maintains an identical turns ratio and normal winding resistance at DC levels, only to fail catastrophically weeks later under the first through-fault current surge.
This diagnostic blind spot is precisely why modern asset managers and utility engineers insist on performing a Sweep Frequency Response Analysis transformer assessment before energization.
The Electrical Physics of Sweep Frequency Response Analysis (SFRA)
At its fundamental physical level, Sweep Frequency Response Analysis transformer diagnostics treat the entire internal assembly as an active transfer impedance network.
Decoding the Four Key Frequency Sub-Bands to Pinpoint Transformer Faults
Interpreting SFRA response curves requires dividing the 20 Hz to 2 MHz spectrum into distinct diagnostic sub-bands.
| Frequency Range | Dominant Electrical Elements | Targeted Defect Detection |
| 20 Hz – 2 kHz | Core magnetizing inductance | Core displacement |
Standardizing Test Configurations: Open-Circuit, Short-Circuit, and Inter-Winding SFRA
To build a comprehensive diagnostic dataset, testing personnel must execute standardized measurement sweeps.
Factory Fingerprinting vs. Commissioning Baselines: Ryan Electric’s Quality Protocol
An SFRA curve is most valuable when compared against a historical fingerprint of the exact same unit.
Field Interpretation Matrix: Analyzing Resonant Peak Shifts and Correlation Coefficients
To quantify trace deviations objectively, diagnostic software utilizes the Cross-Correlation Coefficient.
Best Practices for Field SFRA Testing
To ensure reproducible data conforming to IEEE C57.149 standards, field test engineers must adhere to essential rules.
About the Author & Engineering Advisory
This technical guide is published by the Senior High-Voltage Test & Commissioning Engineering Team at Ryan Electric.
Table of Contents
- Why Visual and Ratio Inspections Fail to Catch Mechanical Transformer Damage
- The Electrical Physics of Sweep Frequency Response Analysis (SFRA)
- Decoding the Four Key Frequency Sub-Bands to Pinpoint Transformer Faults
- Standardizing Test Configurations: Open-Circuit, Short-Circuit, and Inter-Winding SFRA
- Factory Fingerprinting vs. Commissioning Baselines: Ryan Electric’s Quality Protocol
- Field Interpretation Matrix: Analyzing Resonant Peak Shifts and Correlation Coefficients
- Best Practices for Field SFRA Testing
- About the Author & Engineering Advisory